8.2 Why use R markdown?
During the previous Chapters we talked a lot about conducting your research in a robust and reproducible manner to facilitate open science. In a nutshell, open science is about doing all we can to make our data, methods, results and inferences transparent and available to everyone. Some of the main tenets of open science are described here and include:
- Transparency in experimental methodology, observation, collection of data and analytical methods.
- Public availability and re-usability of scientific data
- Public accessibility and transparency of scientific communication
- Using web-based tools to facilitate scientific collaboration
By now all of you will (hopefully) be using R to explore and analyse your interesting data. As such, you’re already well along the road to making your analysis more reproducible, transparent and shareable. However, perhaps your current workflow looks something like this:
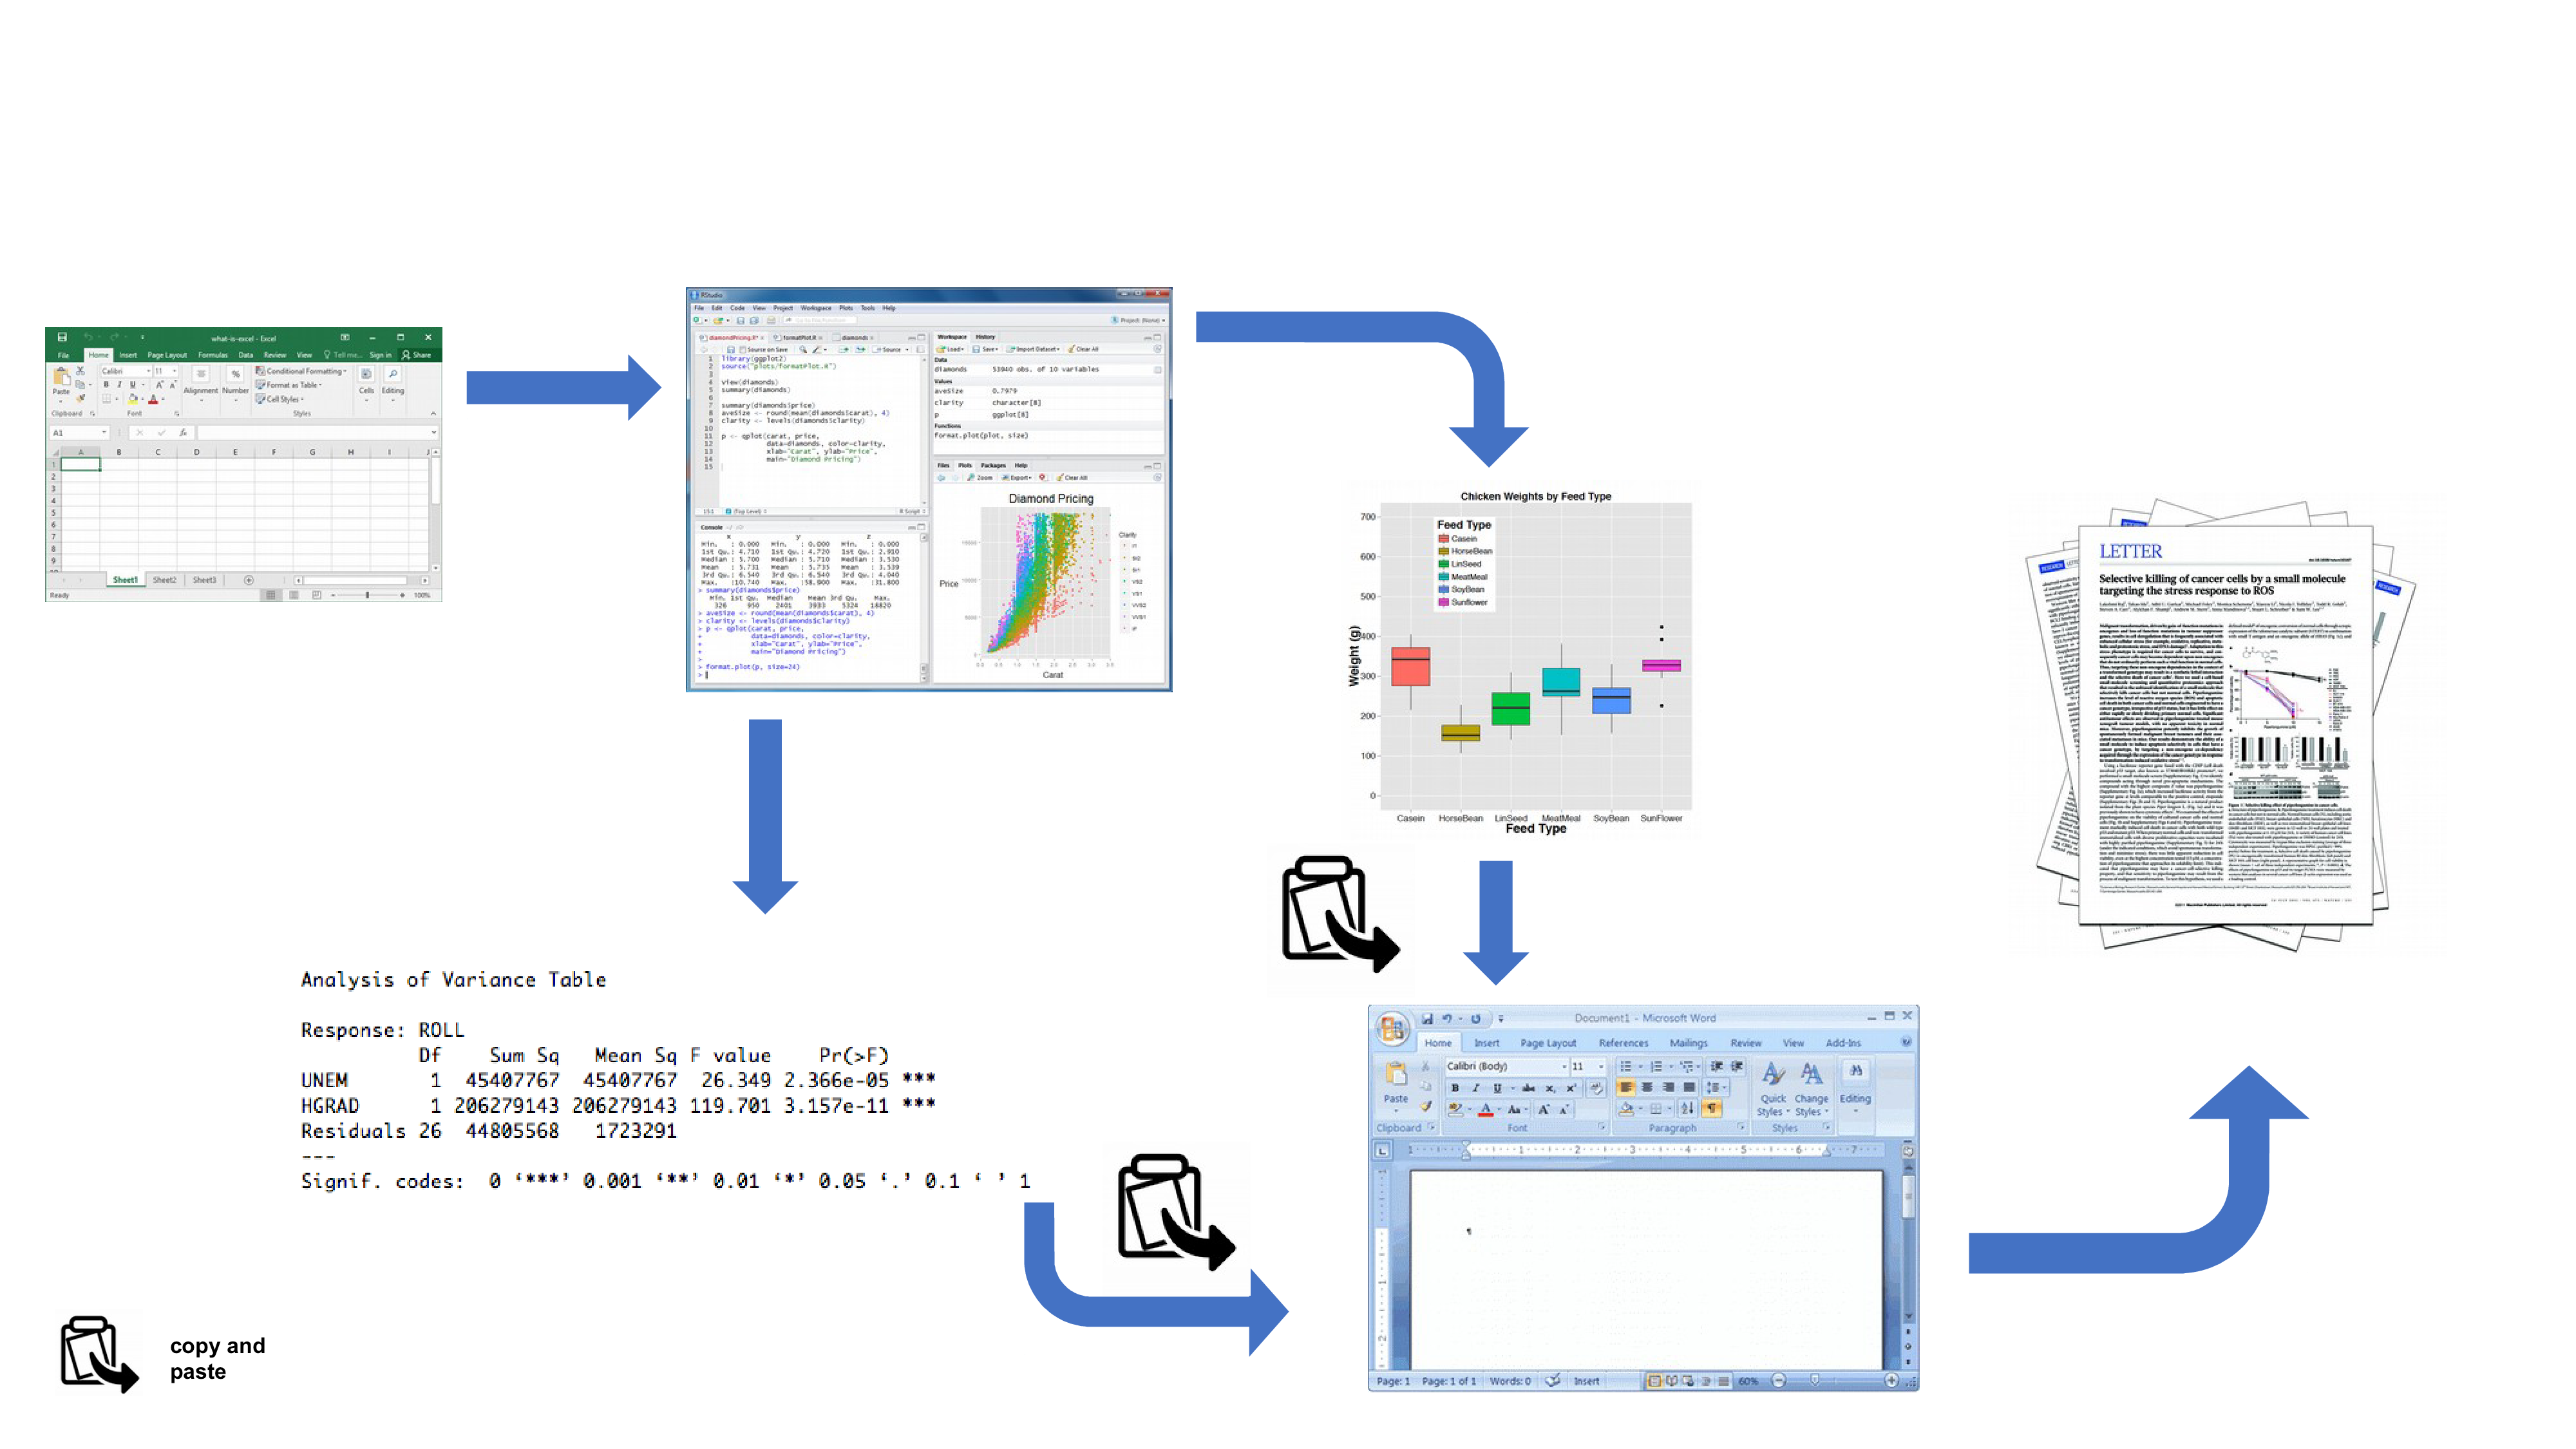
Your data is imported from your favourite spreadsheet software into RStudio (or R), you write your R code to explore and analyse your data, you save plots as external files, copy tables of analysis output and then manually combine all of this and your written prose into a single MS Word document (maybe a paper or thesis chapter). Whilst there is nothing particularly wrong with this approach (and it’s certainly better than using point and click software to analyse your data) there are some limitations:
It’s not particularly reproducible. Because this workflow separates your R code from the final document there are multiple opportunities for undocumented decisions to be made (which plots did you use? what analysis did/didn’t you include? etc).
It’s inefficient. If you need to go back and change something (create a new plot or update your analysis etc) you will need to create or amend multiple documents increasing the risk of mistakes creeping into your workflow.
It’s difficult to maintain. If your analysis changes you again need to update multiple files and documents.
It can be difficult to decide what to share with others. Do you share all of your code (initial data exploration, model validation etc) or just the code specific to your final document? It’s quite a common (and bad!) practice for researchers to maintain two R scripts, one used for the actual analysis and one to share with the final paper or thesis chapter. This can be both time consuming and confusing and should be avoided.
Perhaps a more efficient and robust workflow would look something like this:
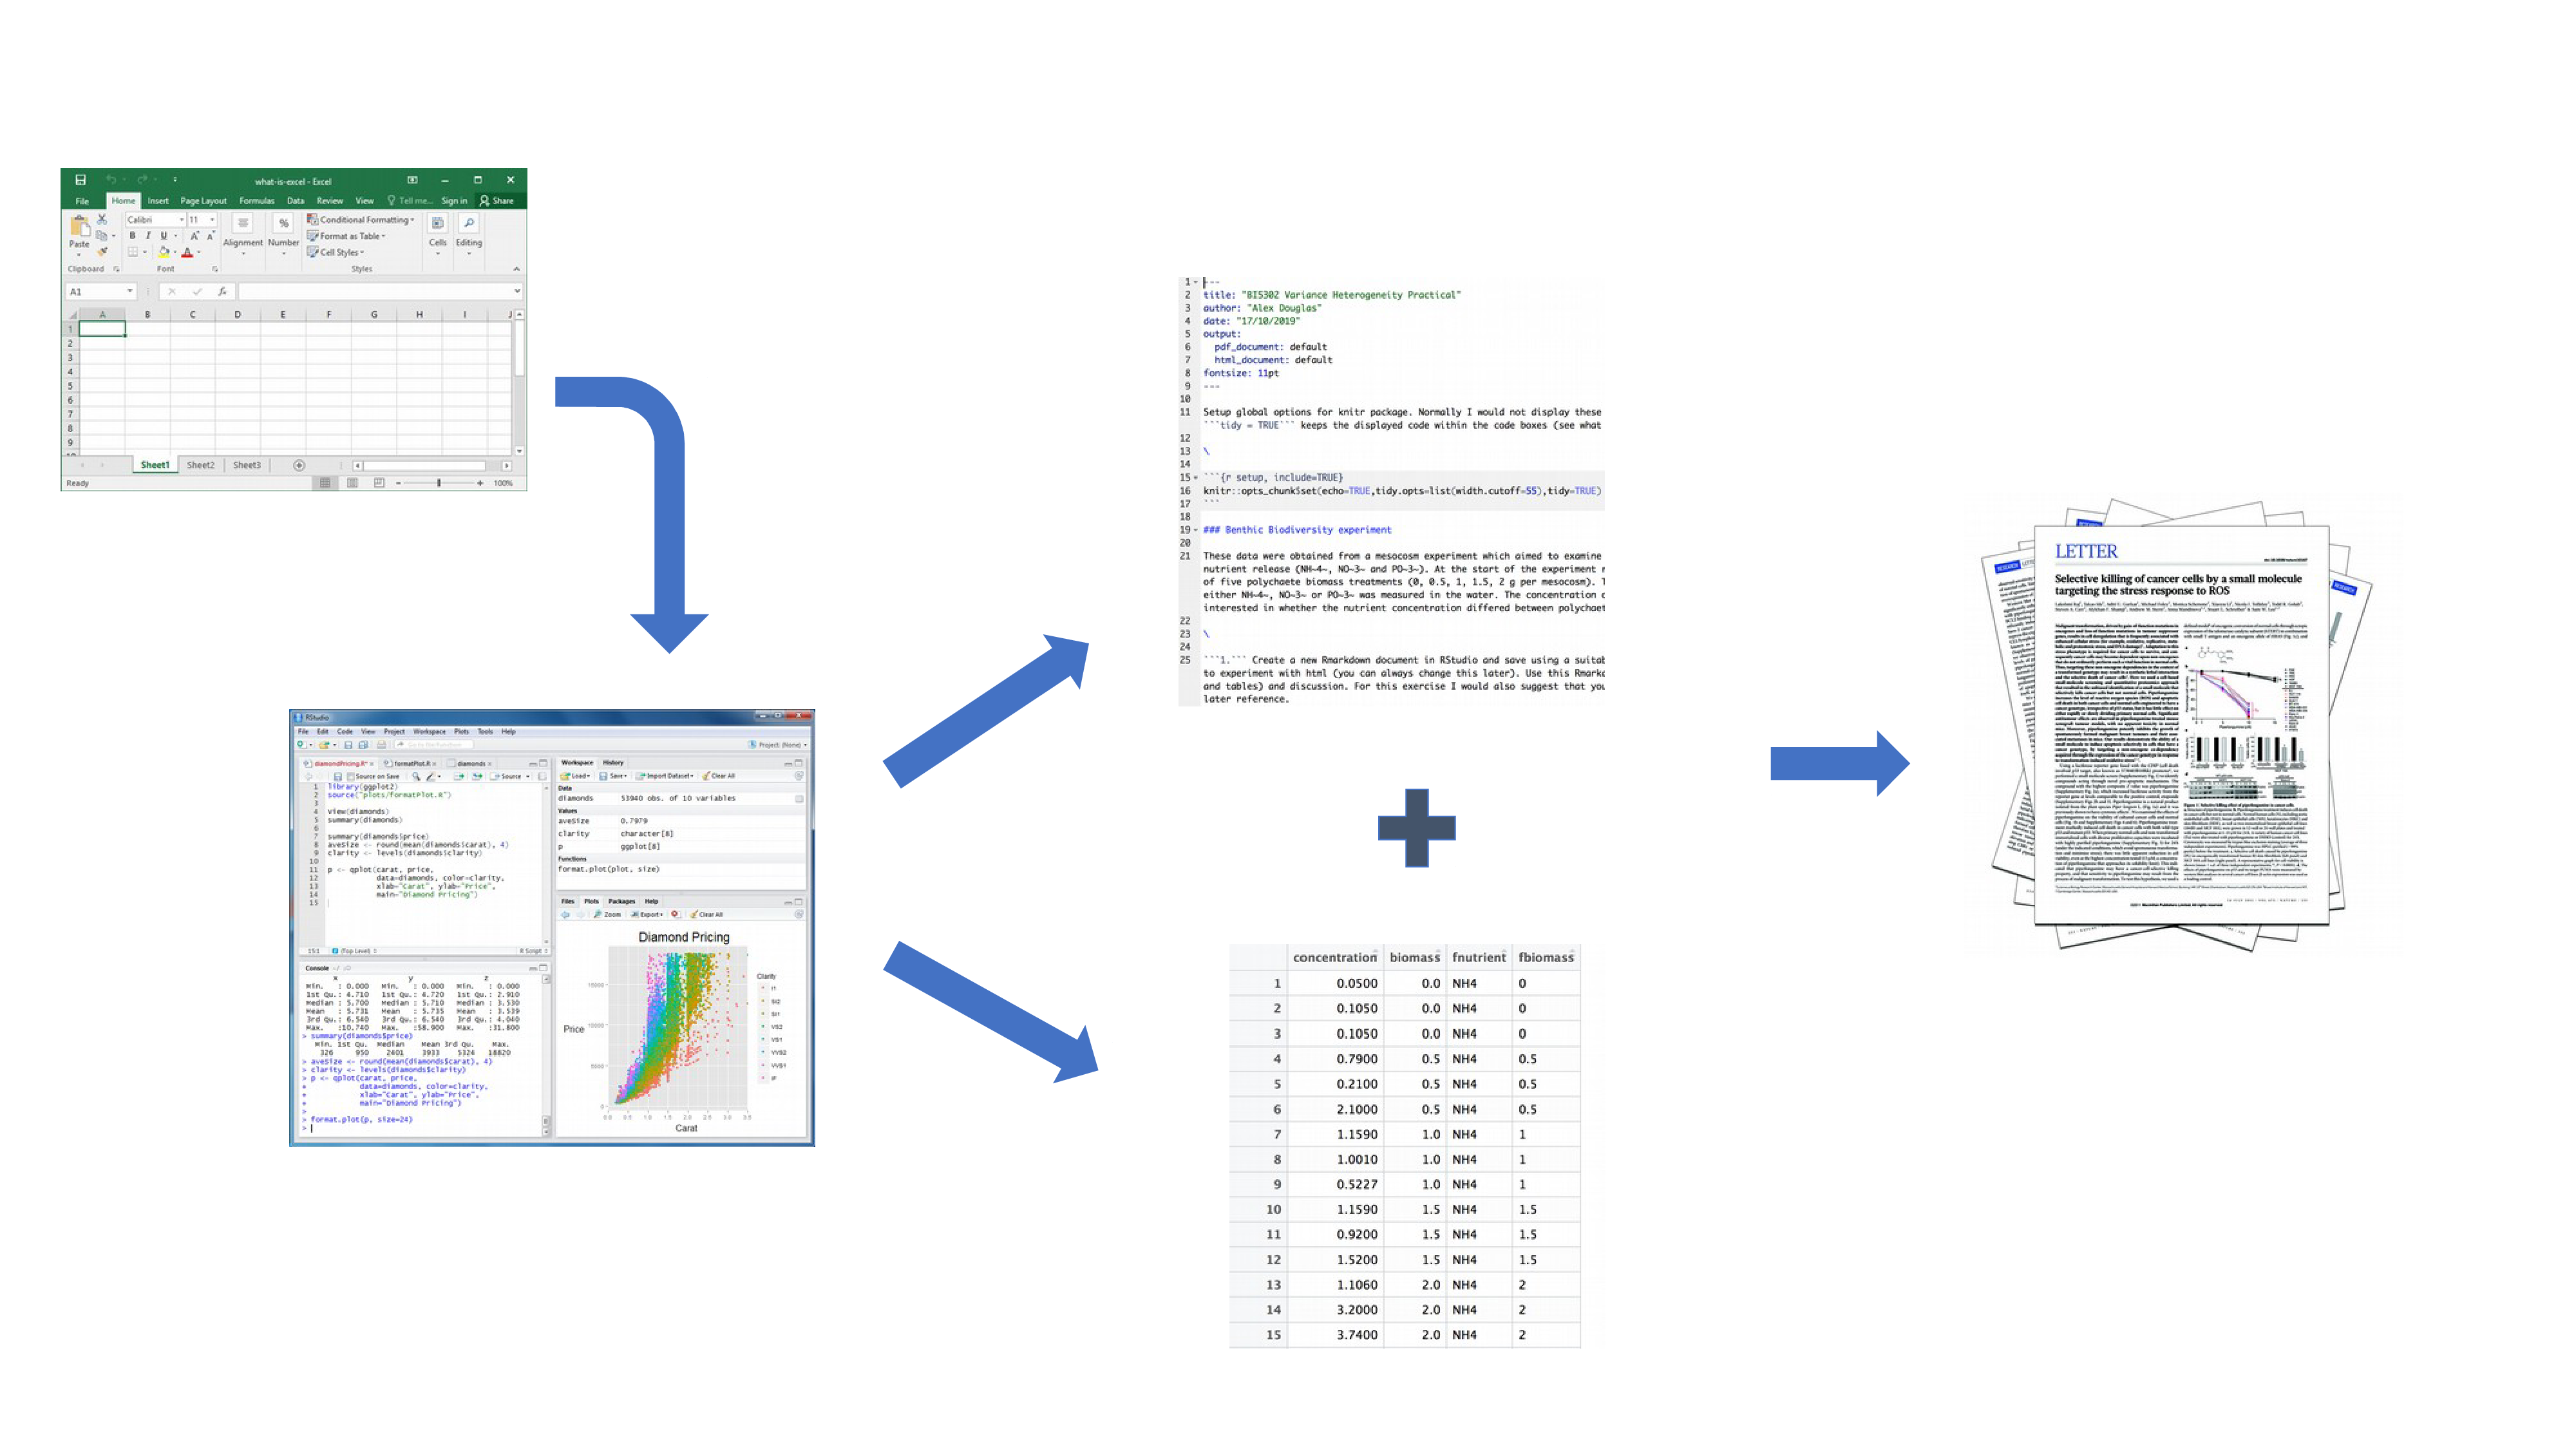
Your data is imported into RStudio (or R) as before but this time all of the R code you used to analyse your data, produce your plots and your written text (Introduction, Materials and Methods, Discussion etc) is contained within a single R markdown document which is then used (along with your data) to automatically create your final document. This is exactly what R markdown allows you to do.
Some of the advantages of using R markdown include:
Explicitly links your data with your R code and output creating a fully reproducible workflow. ALL of the R code used to explore, summarise and analyse your data can be included in a single easy to read document. You can decide what to include in your final document (as you will learn below) but all of your R code can be included in the R markdown document.
You can create a wide variety of output formats (pdf, html web pages, MS Word and many others) from a single R markdown document which enhances both collaboration and communication.
Enhances transparency of your research. Your data and R markdown file can be included with your publication or thesis chapter as supplementary material or hosted on a GitHub repository (see the GitHub Chapter).
Increases the efficiency of your workflow. If you need to modify or extend your current analysis you just need to update your R markdown document and these changes will automatically be included in your final document.